Friday, July 11, 2014
Box Plot
A box plot provides a simple graphical summary of a set of data and shows a measure of central location (the median), the average,and measures of dispersion. Box plots are used through the use of quantiles to measure the 25th percentile range, the 50th percentile range or median range, and the 75th%, with 10% as the minimum range and 90% as the upper. The above image is a box plot comparing a guinea's tooth growth with the amount of vitamin C intake they get. You can see that the data is grouped into box plots, or quantiles, with a lower quantile(25%), the median(50%) depicted by the line through each box, and the upper quantile(75%) above the median to convey it's information.
Climograph Map
A climograph is a graphic representation of the relation between temperature and precipitation as plotted at monthly intervals throughout the year. Lines show maximum and minimum temperatures in degrees on the left axis and bars show precipitation in inches on the right axis. The above image is a climograph of Anchorage, Alaska because it plots the relationship between temperature and precipitation as monthly intervals throughout the year, with lines showing the temperatures in degrees Fahrenheit on the Y-axis and bars showing the amounts of precipitation in inches on the X-axis.
Population Pyramid
Population Pyramids display age and sex distributions for a given area, which forms the shape of a pyramid when the population is growing. The population pyramids are broken in half by two back-to-back bar graphs of the Male gender population shown on the left half and the female population on the right half. The vertical y-axis depicts all age groups for that region and the horizontal x-axis depicts the population in millions. The above image is a population pyramid for the Angola Population in 2012. Here you can clearly see the pyramid is split in to two bar graphs for the male population on the left and the females on the right. The Y-axis depicts their ages and the X-axis conveys the population in millions of people.
Scatterplot
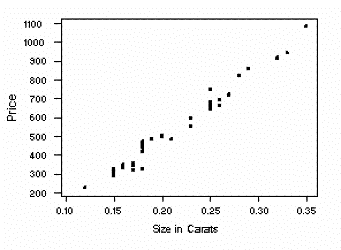
A scatterplot is a type of diagram/graph using the coordinate grid system to display values for two variables for a set of data. The data is displayed as a collection of points, where each observation is represented by a dot., each having the value of one variable determine the position on the horizontal axis and the value of the other variable determine the position of the vertical axis. A trend line can then be inferred based on the direction and concentration of data points. When both variables increase, the trend line is positive. When one variable increases while the other decreases, this conveys a negative relationship. The above image is a very simple example of a scatterplot, comparing the price of some gem in relation to its size in carats. Here you can see the data is plotted as a series of plots, with an increasing trend line here showing that as the size in carats increases so does the price, conveying that this trend is positive.
Index Value Plot
In an index value plot, an index value is plotted on a line graph instead of an absolute number, and makes all plotted values relative to this index value. The above image is an index value plot for the expansion and downsizing of companies. Here, the index value is 50, and all other points are plotted in reference to this index value. So, when the index value is above 50, that means more companies are expanding than contracting and when the index value is below 50, more companies are contracting than expanding.
Accumulation Line Graph
An accumulation line graph, also called a Lorenz curve, consists of a line on the graph which shows how the data would be graphed if whatever property being measured was equally distributed. Then there is another line, called the Lorenz curve, which represents the actual distribution of whatever feature under study. From viewing the distribution/accumulation of the graph a trend can then be found. In economics, a Lorenz curve is a graphical representation of the cumulative distribution of the empirical probability distribution of wealth, first developed by Max Lorenz in 1905 for representing inequality in wealth distribution. Accordingly, the accumulation line graph is often used to display income distribution. The above image is a clear example of a accumulation line graph or Lorenz curve of income distribution, in which the Lorenz curve is obtained by plotting the cumulative percentages of household income against the cumulative percentages of the number of household, starting from the homes with the lowest income. The Lorenz curve would be the line of equality if there was an absolutely equal distribution of income. However, since it is not equally distributed, the degree of income disparity is reflected by the amount that the Lorenz curve concaves against this line of equality. So, a trend could be made here that the closer the Lorenz curve is to the line of equality, the smaller the amount of income disparity there is.
Bilateral Graph
A bilateral graph is a graph of two related variables, in which areas/lines sometimes overlap where variables share some feature or characteristic in common. The above image is a bilateral graph because it's displaying two related variables, both China and Russia denouncing the US dollar in terms of using their own currencies. Here you can see these relationships are graphed in terms of bilateral trade between Russia and China denouncing the US dollar.
Subscribe to:
Posts (Atom)